
Platform · Normalization
Financial Data Normalization for Private Markets
Different GPs, different templates, different terminology, different currencies, different reporting periods. Zanran turns them into one consistent, comparable dataset.
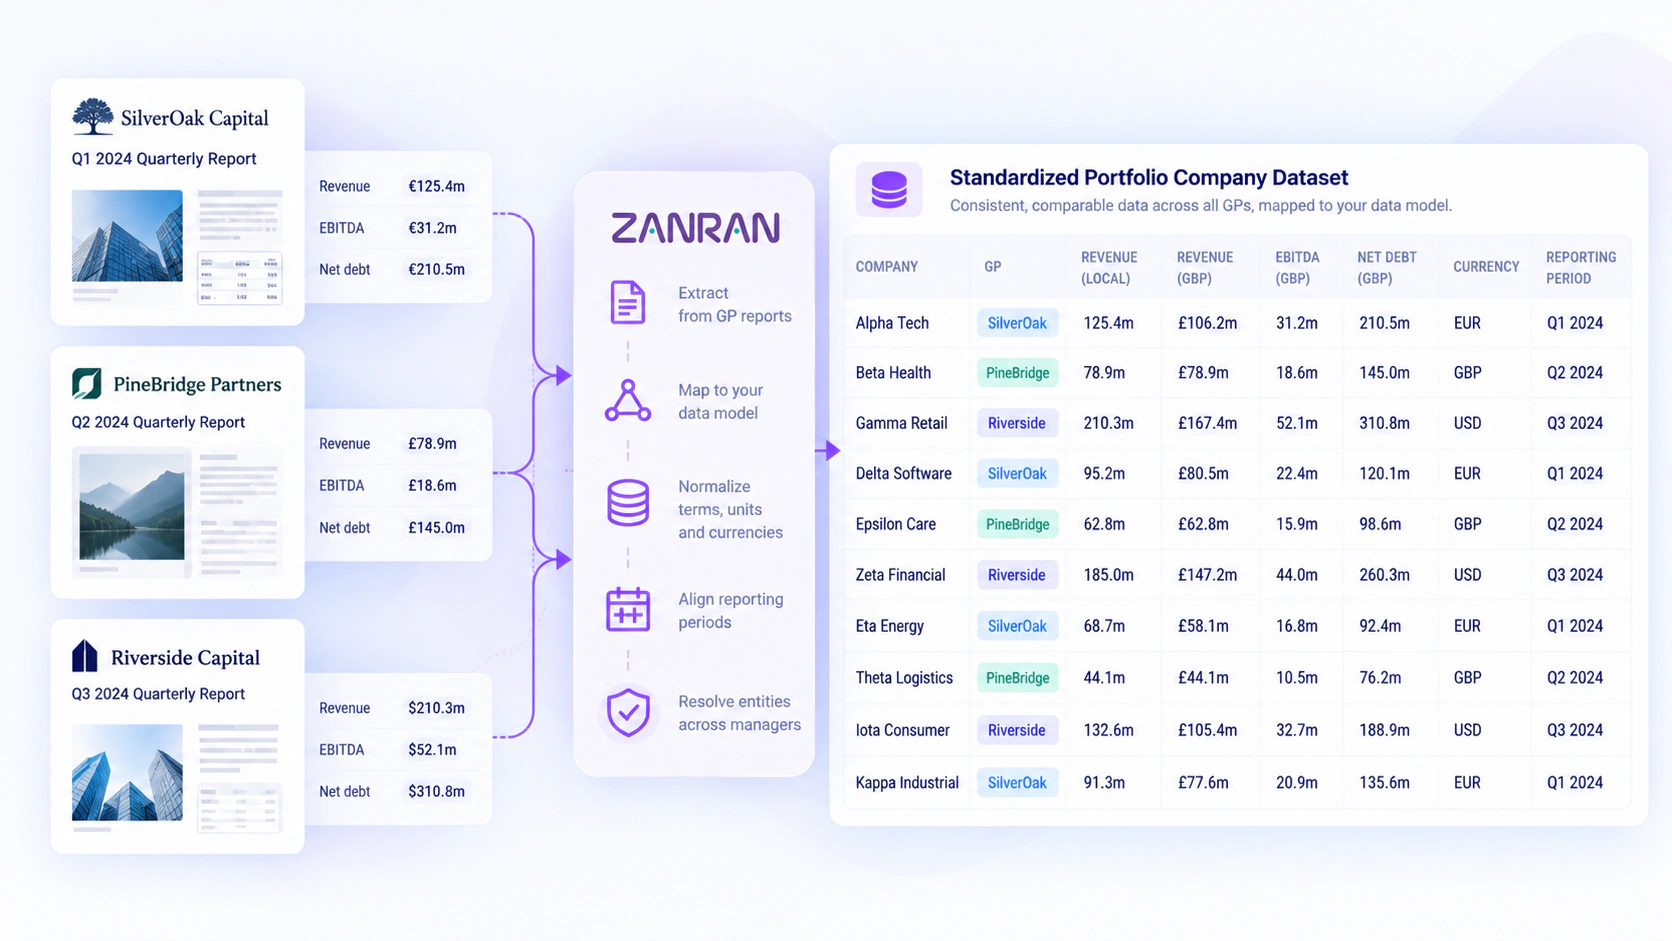
Illustrative visual with sample data.
What Is Financial Data Normalization?
Financial data normalization is the process of converting financial data from different sources into a single consistent format - aligning metric definitions, units, currencies and time periods - so that figures from different companies, managers and reports can be compared directly.
Why GP Data Is Not Comparable Out of the Box
- Different GPs
- Different templates
- Different terminology
- Different currencies
- Different reporting periods
- Zanran → your data model
An LP with commitments to thirty managers effectively receives thirty different data formats. Without normalization, every cross-portfolio question - total exposure to a sector, average leverage, valuation trends - requires manual reconciliation first.
What Zanran Normalizes
| Dimension | The problem | How Zanran resolves it |
|---|---|---|
| Terminology | “Sales”, “Turnover”, “Net revenue” | Mapped to one standard metric definition |
| Units | Thousands vs millions vs actuals | All converted to actuals |
| Currency | Multi-currency portfolios | Fund currency and portfolio company currencies reported separately |
| Periods | Quarter, LTM, YTD, different year-ends | Tagged and aligned to comparable periods |
| Entities | Same company named differently across GPs | Resolved to a single portfolio company record |
| Templates | GP layouts change over time | Model adapts; output schema stays the same |
Your Data Model
Zanran's Platform organizes data at portfolio company and fund levels, with consistent definitions for operational metrics, valuation inputs and static attributes. The result is clean, comparable and analysis-ready data at scale - the same shape every quarter, whichever managers report and however their templates change.
Why Normalization Is the Real Differentiator
Extraction gets the numbers out of the PDF. Normalization makes them useful. It is what enables performance benchmarking across managers, exposure and risk assessment across the whole book, and time-series analysis that is not broken every time a GP redesigns its report.
FAQ
Frequently Asked Questions
Straight answers to the questions investment teams ask most. Still curious? Talk to us.
What is financial data normalization?
Financial data normalization converts financial data from different sources into one consistent format by aligning metric definitions, units, currencies and periods, so figures from different companies and managers can be compared directly.
Can GP reports from different managers be standardized?
Yes. Zanran maps data from every manager's template to your data model, reconciling terminology, units, currencies, reporting periods and company names, so the output is consistent regardless of the source format.
How does Zanran handle multi-currency portfolios?
Zanran captures each value in its local reporting currency and tags it, so data can be analyzed in local currency or in a consistent reporting currency across the portfolio.
See Zanran in Action
Upload a set of GP reports and see asset-level data extracted, normalized and traceable to source - in minutes.