
How it works
How Zanran Turns GP Reports Into Investment Intelligence
Six steps, one automated pipeline: from a folder of quarterly reports to clean, standardized, traceable, fund-level and asset-level data. The pipeline is controlled and managed by the client.
The Six-Step Zanran Process

- 01
Ingest
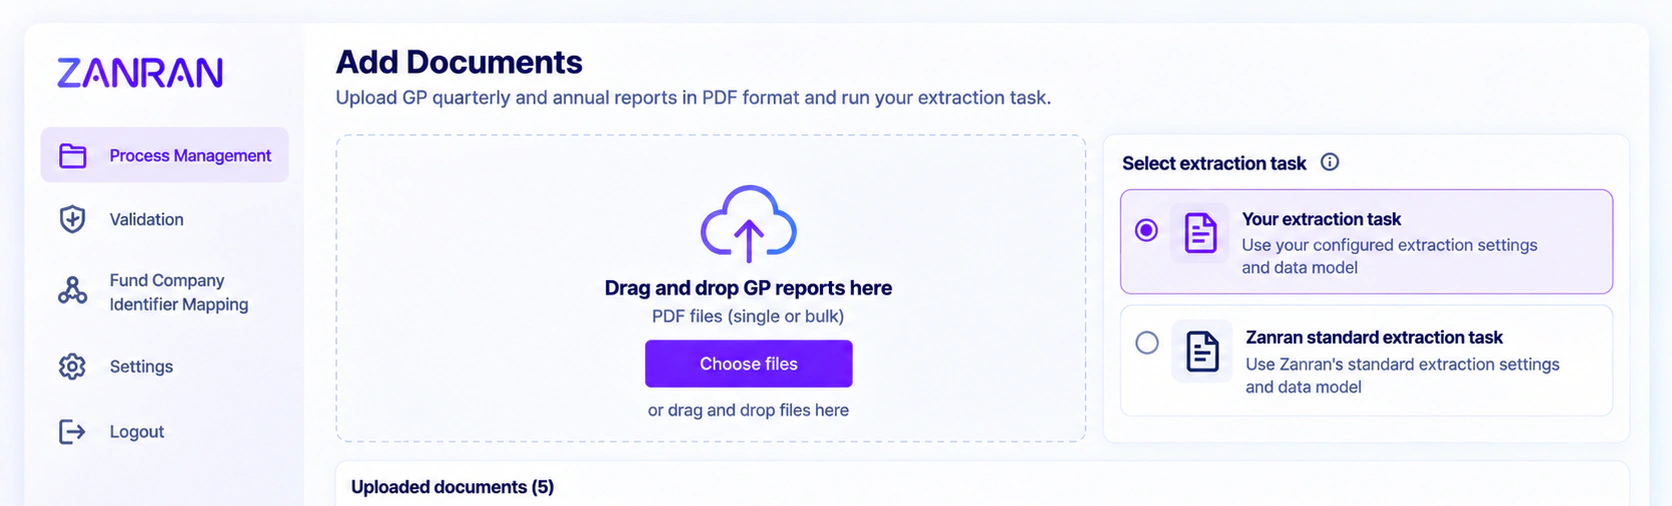
Upload GP quarterly and annual reports singly or in bulk, manually or by API, and run your extraction task. Zanran does not require fund names or portfolio-company names to be added separately. You just upload the PDFs.
- 02
Extract
Computer vision analyzes each page visually, locating tables, charts and text blocks, and identifies the fund, reporting period and portfolio companies. Then operational metrics, valuation inputs and static attributes are captured for every asset, together with units, currency and period. Units (e.g. millions), currencies and reporting periods are extracted so data is comparable across GPs and time.
- 03
Map
Each value is mapped to the correctly-named metric and to the correct portfolio company record.
- 04
Validate
Data is checked by humans for consistency and completeness. Every value keeps a link to its source location for one-click verification.
- 05
Approve
You get a final check on any key parameters.
- 06
Publish
Output as Excel. Output as JSON. Output as CSV. Manually or by API call.
See the Transformation
1 Source PDF
PDF Q2 2026 GP Quarterly Report · p.14
Revenue £125.4m
EBITDA £31.2m
EV £420m
2 Zanran structured data
| Metric | Value | Source |
|---|---|---|
| Revenue | £125.4m | Q2 2026 GP Report |
| EBITDA | £31.2m | Q2 2026 GP Report |
| EV | £420m | Q2 2026 GP Report |
3 Portfolio intelligence
EBITDA margin 24.9%
EV / EBITDA 13.5x
Traceable page & cell
Illustrative figures. Every value in Zanran links back to its location in the original report.
Designed for Real-World Reporting
Zanran's technology is designed for the complexity of real-world reporting: diverse formats, inconsistent disclosures, multi-currency portfolios and evolving GP templates. With an automated pipeline, Zanran delivers accuracy, auditability and repeatability across every reporting cycle.
FAQ
Frequently Asked Questions
Straight answers to the questions investment teams ask most. Still curious? Talk to us.
How does AI extract data from GP reports?
Zanran analyzes each report page visually with computer vision to find tables and relevant text, identifies the fund, period and portfolio companies, captures each metric with its units and currency, maps it to your data model and keeps a link to its source location.
How long does it take to get started?
Reports can be uploaded by drag-and-drop and processed in minutes. Book a demo and we will walk through the process using sample GP reports.
See Zanran in Action
Upload a set of GP reports and see asset-level data extracted, normalized and traceable to source - in minutes.