
Platform · Portfolio intelligence
Private Markets Portfolio Intelligence
Turn GP quarterly and annual reports into a whole-portfolio view: overall NAV, unfunded capital, your largest funds and exposure by sector, geography and strategy - with every value traced to its source.
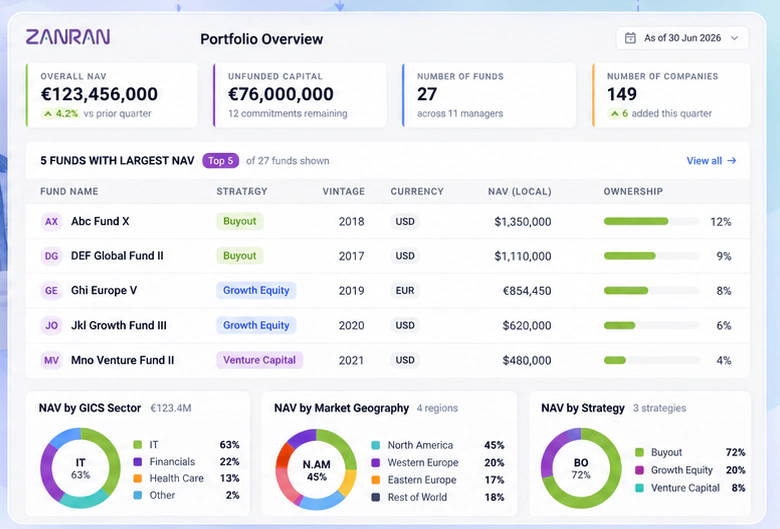
Illustrative visual with sample data.
The Complete Private Markets Intelligence View
This is what clean, standardized GP report data makes possible. Zanran extracts fund- and asset-level data from every GP report you receive, maps it to your data model and delivers it - as Excel, JSON or CSV, manually or by API - ready to power your portfolio views, dashboards and reporting.
What the Portfolio Overview Shows
Four headline figures summarize the whole private markets programme at a glance, each built from the underlying GP reports rather than keyed in by hand.
Overall NAV
Total net asset value across every fund, with the movement against the prior quarter.
Unfunded capital
Commitments not yet called, and how many commitments remain open.
Number of funds
Every fund in the programme and the number of managers behind them.
Number of companies
The portfolio companies held across all funds, including those added this quarter.
Your Largest Funds at a Glance
See which funds carry the most NAV, alongside each fund's strategy, vintage, reporting currency, NAV in local currency and your ownership share. Because the data comes from the GP reports themselves, the view refreshes every reporting cycle without re-keying.
Each figure can be followed down to the fund, the portfolio company and the page of the GP report where it was disclosed.
Exposure by Sector, Geography and Strategy
Asset-level data makes look-through exposure possible. NAV can be broken down by GICS sector, by market geography and by strategy - buyout, growth equity, venture capital - weighted by ownership, so concentration risk is visible across every manager you invest with.
Learn more about asset-level intelligence.
Built From the GP Reports You Already Receive
- GP quarterly & annual reports
- Zanran extraction
- Mapped to your data model
- Human validation
- Portfolio intelligence
No new data requests to managers are needed. Zanran reads the reports you already receive, in whatever format each GP uses. The data has to be present in the report - the Zanran Platform does not make up (hallucinate) figures - and results are checked by people before they are released.
See the full six-step process.
Every Value Traced to Source
Portfolio intelligence is only useful if it can be trusted. Every number in the view keeps a link to the report, page and table it came from, so analysts, auditors and investment committees can verify any figure in seconds.
Private Equity and Private Credit in One View
Zanran covers both private equity and private credit, so fund and borrower data can sit side by side in one portfolio view. Real estate is not covered at present.
Built for LPs and Investment Teams
LPs & allocators
Look through every GP to the portfolio companies underneath.
Learn moreInvestment managers
Consolidate portfolio data for monitoring and investor reporting.
Learn moreFund administrators
Process GP reports at scale for multiple clients.
Learn moreConsultants
Benchmark managers and support due diligence on consistent data.
Learn moreFAQ
Frequently Asked Questions
Straight answers to the questions investment teams ask most. Still curious? Talk to us.
What is private markets portfolio intelligence?
Private markets portfolio intelligence is a consolidated view of a private equity and private credit programme - NAV, unfunded commitments, largest positions and exposure by sector, geography and strategy - built from the fund- and asset-level data in GP quarterly and annual reports.
Does Zanran provide this dashboard?
The view shown is illustrative and uses sample data. Zanran delivers the standardized fund- and asset-level data behind it - as Excel, JSON or CSV, manually or by API - so it can feed your own dashboards, BI tools and reporting.
Where does the portfolio data come from?
From the GP quarterly and annual reports investors already receive. Zanran extracts the figures, maps them to your data model and links each value to its source page; the data has to be present in the report.
How often is the portfolio view updated?
Every reporting cycle. As new GP reports arrive they are processed in bulk, so the fund and portfolio company data stays consistent quarter after quarter.
Does it cover private credit and real estate?
Zanran covers private equity and private credit portfolios. Real estate is not covered at present.
See Zanran in Action
Upload a set of GP reports and see asset-level data extracted, normalized and traceable to source - in minutes.