
Private equity · GP reports
AI-Powered GP Report Automation
Automate the grind. Accelerate the insight. Zanran turns every GP quarterly and annual report into clean, standardized, asset-level data - in minutes.
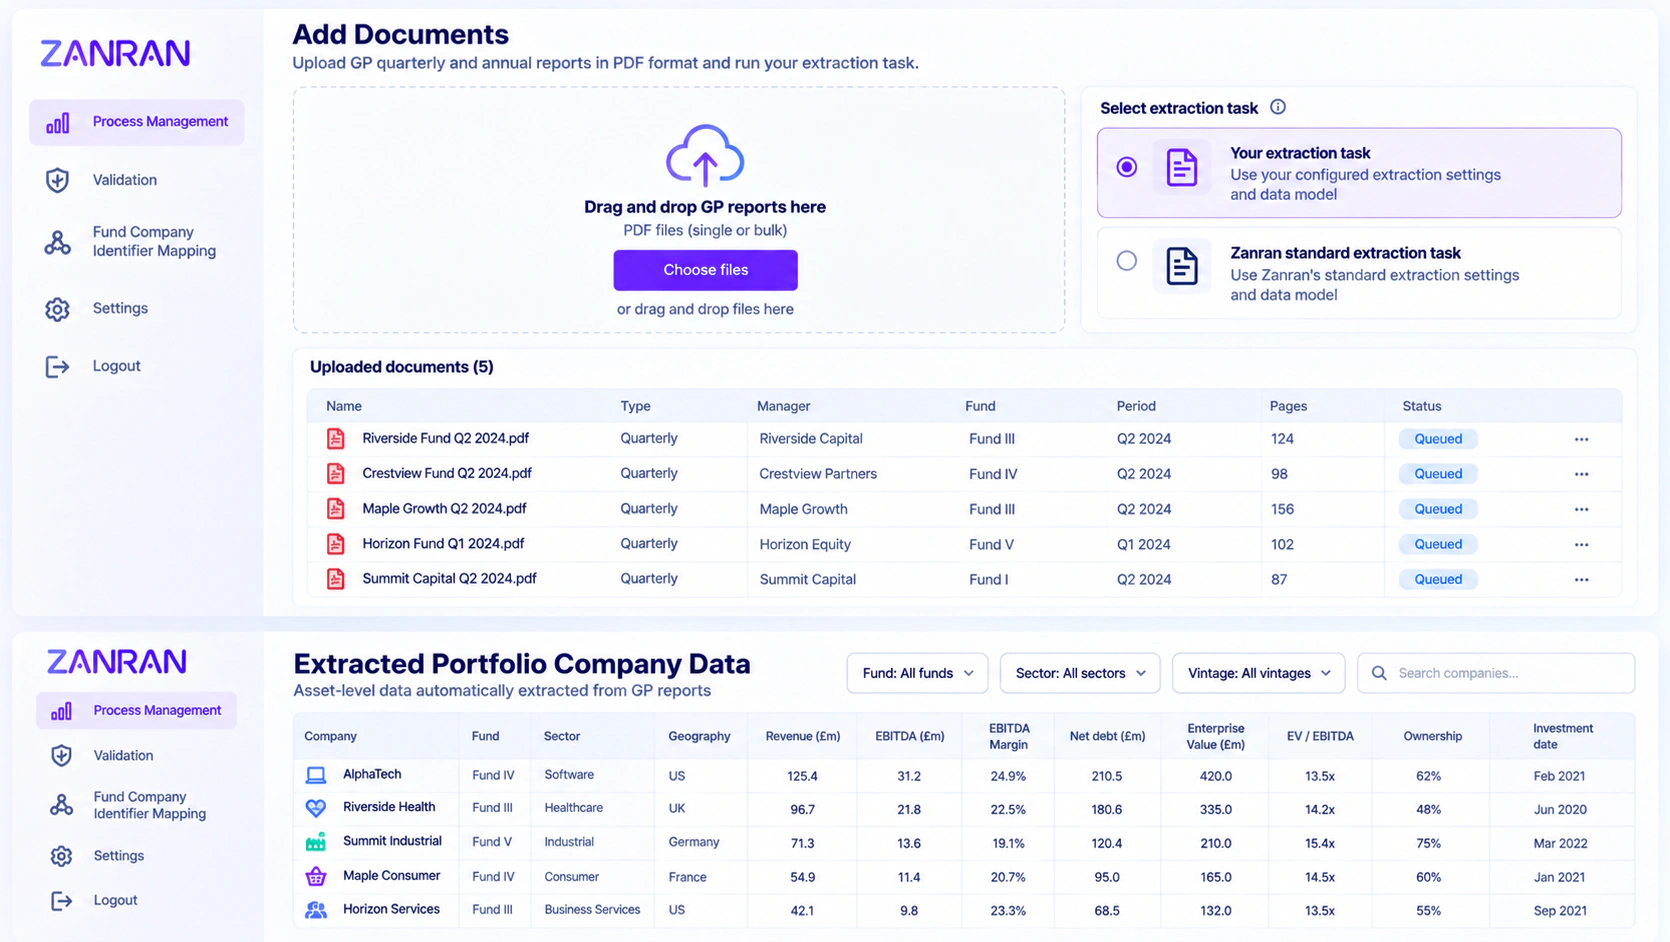
Illustrative visual with sample data.
What Is a GP Report?
A GP report is a periodic report - usually quarterly, with a fuller annual version - that a private fund's general partner (GP) sends to its limited partners (LPs). It covers fund performance, capital account information, and updates on each portfolio company or loan, including financials and valuations.
Why GP Reports Are Difficult to Analyze
- Every GP uses a different template, and templates change over time.
- Critical asset-level data is spread across dozens of pages of tables and narrative.
- Metrics are named, defined and presented inconsistently between managers.
- Portfolios are multi-currency and reporting periods may differ.
- Reports arrive in a compressed window each quarter, creating a processing peak.
The Problem With Manual GP Report Processing
Manual processing means analysts copying figures from PDFs into spreadsheets, cycle after cycle. It is slow - weeks lost each quarter; limited - most teams capture only fund-level data; error-prone; and hard to audit. Manual workflows slow reporting cycles, weaken investor confidence and reduce agility.
Extracting Data From Quarterly Reports
Zanran automatically extracts operational metrics, valuation parameters and static attributes for every portfolio company - with no human intervention - along with each fund's data: static data, financial status and performance.
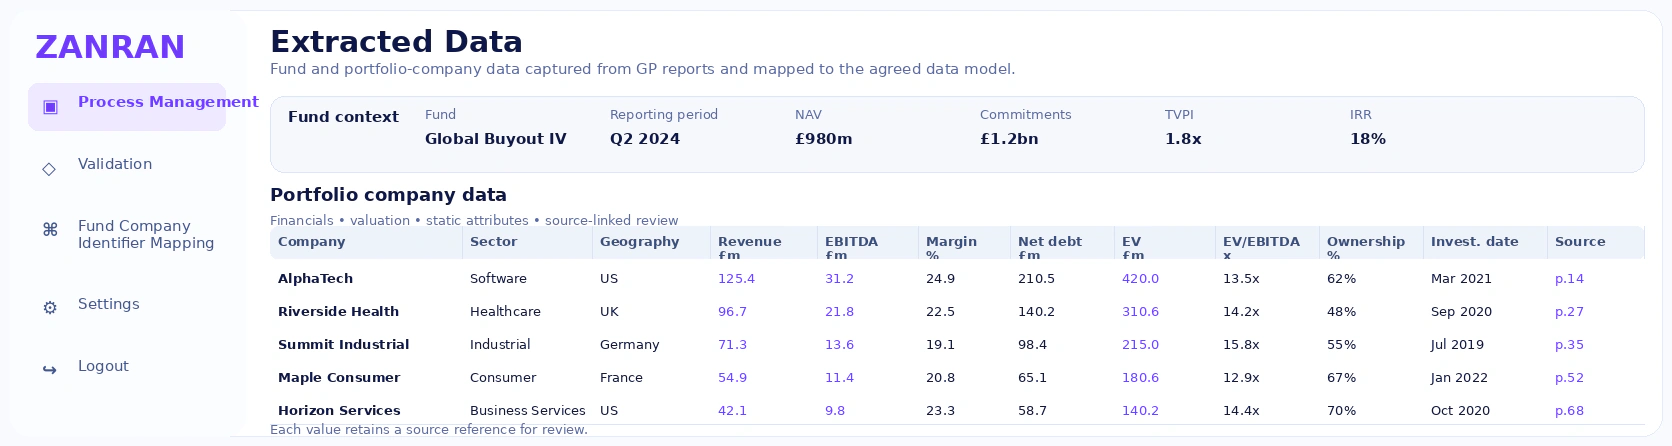
Mapping Portfolio Companies
Each company is matched to a persistent record, so its data lines up across quarters - and across GPs when several managers hold the same asset.
Normalizing GP Data
Terminology, units, currencies and periods are standardised into one data model.
Comparing Data Across Reporting Periods
Because every cycle is processed identically, Zanran builds a consistent time series for each asset, so quarter-on-quarter changes are immediately visible.
Tracking Valuation Changes
Follow each asset's fair value, multiple and underlying performance over time and see where valuations have moved.
Building an Automated GP Reporting Workflow
- GP report
- Document AI
- Data extraction
- Data mapping
- Normalization
- Validation
- Portfolio intelligence
GP Report Data With Source-Level Traceability
1 Source PDF
PDF Q2 2026 GP Quarterly Report · p.14
Revenue £125.4m
EBITDA £31.2m
EV £420m
2 Zanran structured data
| Metric | Value | Source |
|---|---|---|
| Revenue | £125.4m | Q2 2026 GP Report |
| EBITDA | £31.2m | Q2 2026 GP Report |
| EV | £420m | Q2 2026 GP Report |
3 Portfolio intelligence
EBITDA margin 24.9%
EV / EBITDA 13.5x
Traceable page & cell
Illustrative figures. Every value in Zanran links back to its location in the original report.
From any part of your portfolio you can drill down to the underlying data in the original report - for full transparency.
FAQ
Frequently Asked Questions
Straight answers to the questions investment teams ask most. Still curious? Talk to us.
What is GP report automation?
GP report automation is the use of software to convert the quarterly and annual reports that general partners send to investors into structured data automatically - extracting, mapping, normalizing and validating fund and portfolio company data instead of re-keying it by hand.
How does AI extract data from GP reports?
Zanran analyzes each page visually to locate tables and relevant text, then identifies the fund, period and portfolio companies, captures each metric with its units and currency, and maps it to standard names - keeping a link to the exact source location.
What information can be extracted from GP reports?
Fund-level information such as NAV, commitments and performance, and asset-level data for every portfolio company - revenue, EBITDA, margins, cash flow, net debt, enterprise value, multiples, cost, fair value, ownership, sector and geography.
Can GP reports from different managers be standardized?
Yes. Zanran maps each manager's data to your standard model, reconciling terminology, units, currencies, reporting periods and company names, so data from every GP is directly comparable.
How does Zanran validate extracted data?
Zanran's automated pipeline checks extracted data for consistency and completeness and keeps a link from every value to its source location, so reviewers can verify any figure in one click and focus on exceptions rather than re-checking every number.
Can users trace extracted data back to the source report?
Yes. Every data point in Zanran is linked to the report, page and location it came from. You can drill down from the fund to the asset, the metric and then the original disclosure.
See Zanran in Action
Upload a set of GP reports and see asset-level data extracted, normalized and traceable to source - in minutes.