
Guide
GP Report Data Standardization: A Practical Guide
Extraction gets the numbers out. Standardization makes them comparable. A practical guide to building one consistent dataset from many GPs.
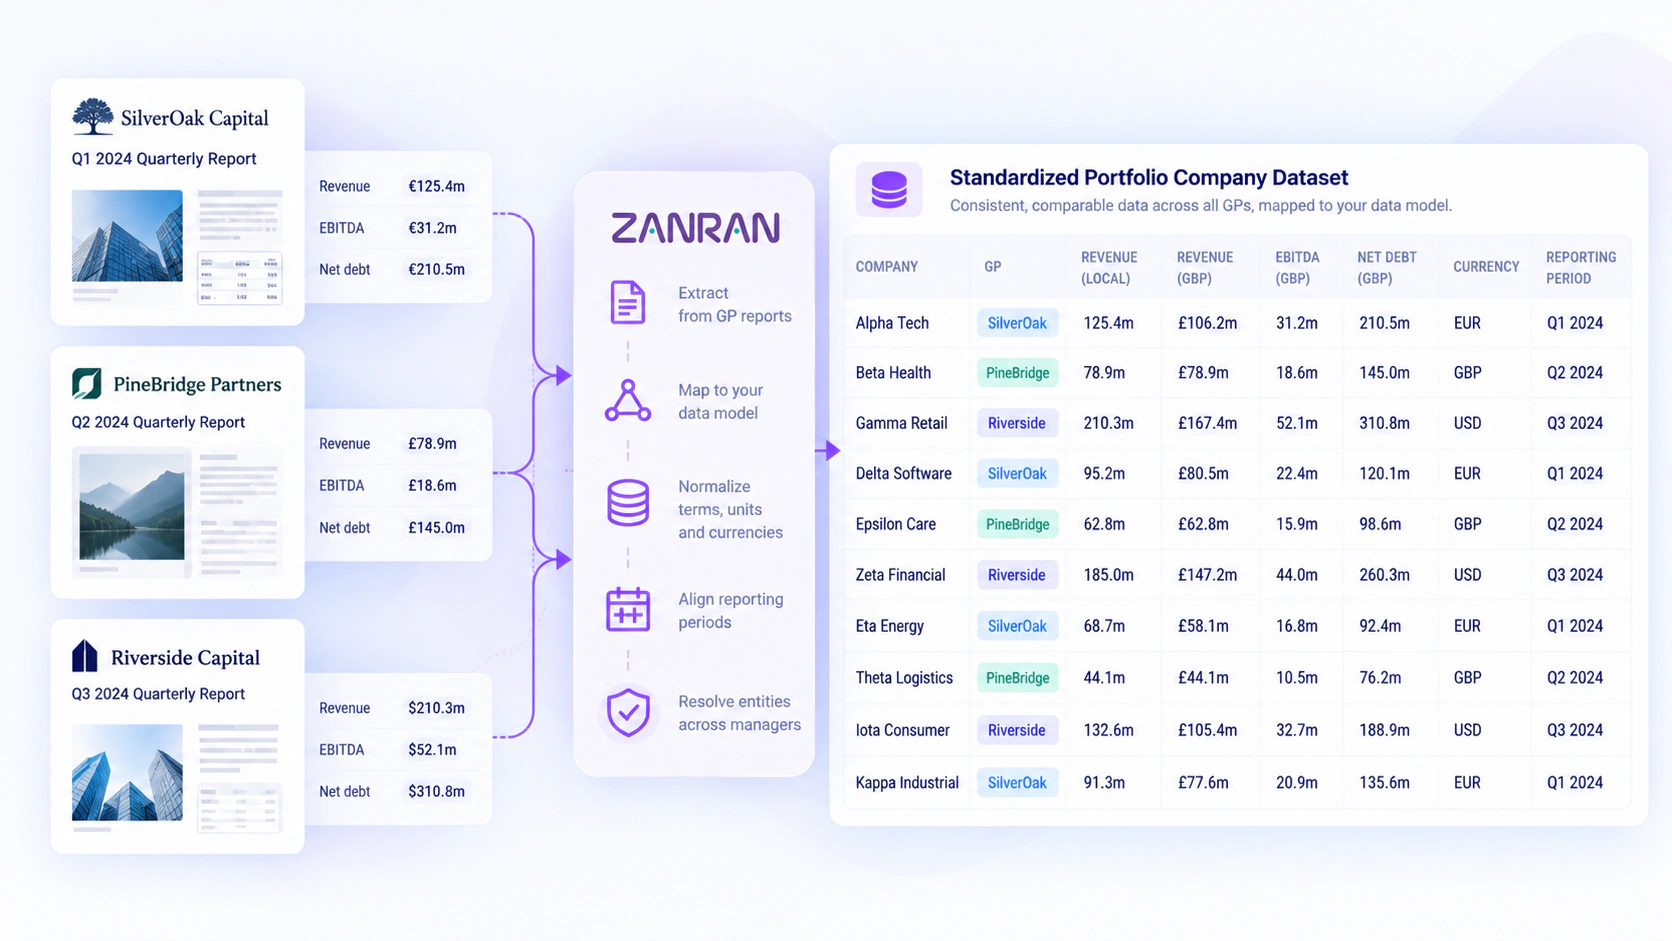
Illustrative visual with sample data.
Why Standardize GP Report Data?
Without standardization, every cross-manager question requires manual reconciliation. With it, benchmarking, exposure analysis and time-series tracking become routine.
Design a Target Data Model
Define entities (portfolio, fund, asset), metrics with precise definitions, and required context for each value: unit, currency, period type and period end.
Map Terminology
Build a mapping from each GP's labels to your standard metrics - e.g. “Sales”, “Turnover” and “Net revenue” to Revenue - and decide how to treat adjusted vs reported figures.
Handle Units and Currencies
Record the unit and currency stated for each table, convert to consistent units, and keep local-currency values alongside any converted reporting-currency figures.
Align Reporting Periods
Tag each value as quarterly, year-to-date or last-twelve-months and record the period end, so comparisons are like-for-like.
Resolve Entities
Match portfolio companies across periods and across GPs to persistent identifiers so histories and overlaps are captured correctly.
Preserve Data Lineage
Keep a link from every standardized value to its source report and page. Lineage is what makes standardized data auditable. How Zanran normalizes data.
FAQ
Frequently Asked Questions
Straight answers to the questions investment teams ask most. Still curious? Talk to us.
How do you standardize GP report data?
Design a target data model, map each GP's terminology to standard metrics, convert units and currencies, align reporting periods, resolve company identities across reports and keep a link from every value to its source.
See Zanran in Action
Upload a set of GP reports and see asset-level data extracted, normalized and traceable to source - in minutes.